Reports & Research
Cyber Warfare Case Study: Salt Typhoon
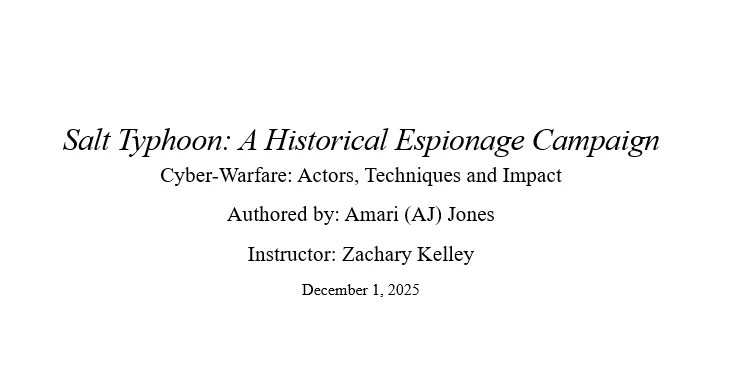
An academic analysis of the Salt Typhoon cyber-espionage campaign.
Explore projectA Power BI dashboard for Ingress Management Services and Facilities Services, tracking monthly key-cutting workload, completion time, and backlog trends from 2023 onward.
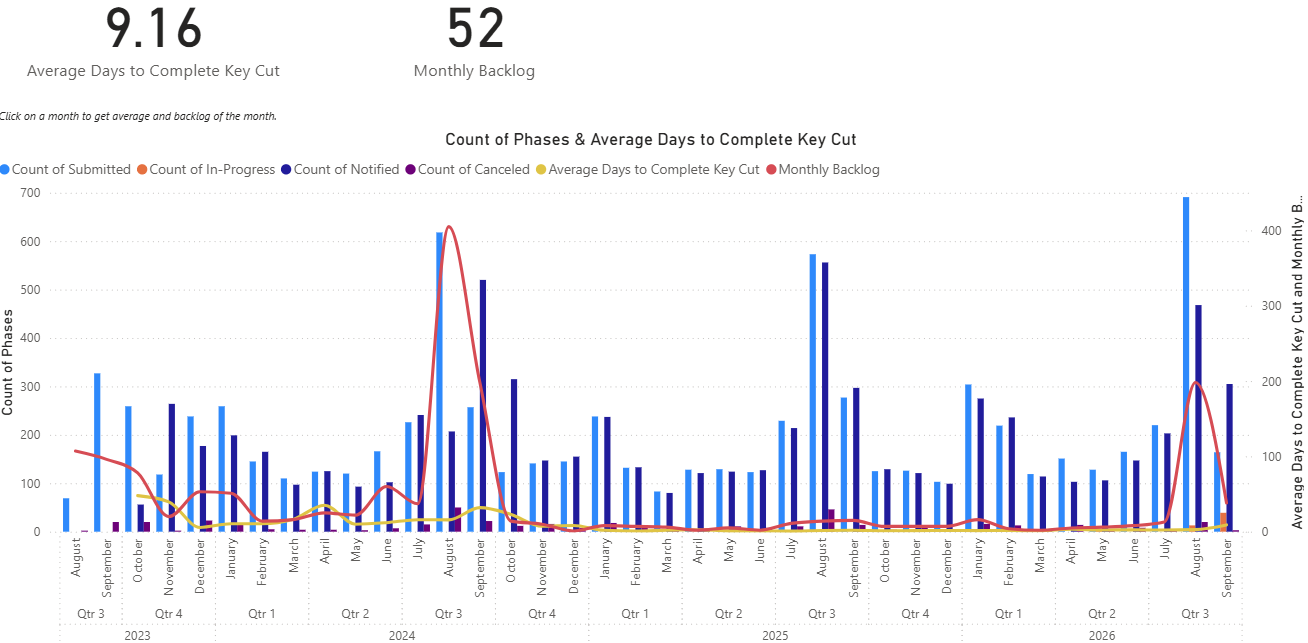
Ingress Management Services and Facilities Services needed a clearer view of their key-cutting process: how much work was arriving, what was still in progress, how many customers had been notified, and how long completion was taking.
The dashboard brings these measures together with historical backlog trends so the teams can review monthly activity and identify periods when outstanding work peaked.
The Power BI report combines headline indicators for average days to complete a key cut and monthly backlog with a monthly trend chart. Columns compare submitted, in-progress, customer-notified, and canceled work-order phases, while lines show average completion time and backlog.
The historical view begins in 2023 and extends through the latest available reporting period. In the Power BI report, selecting a month shows the average completion time and backlog for that month.
I assisted throughout the development process as a contributor to the dashboard, supporting the effort to give Ingress Management Services and Facilities Services useful information about their key-cutting operations.
The dashboard gives both teams a shared view of key-cutting activity, turnaround time, and outstanding work. Comparing monthly volumes with completion-time and backlog trends helps them examine busy periods and understand changes in the process over time.
An academic analysis of the Salt Typhoon cyber-espionage campaign.
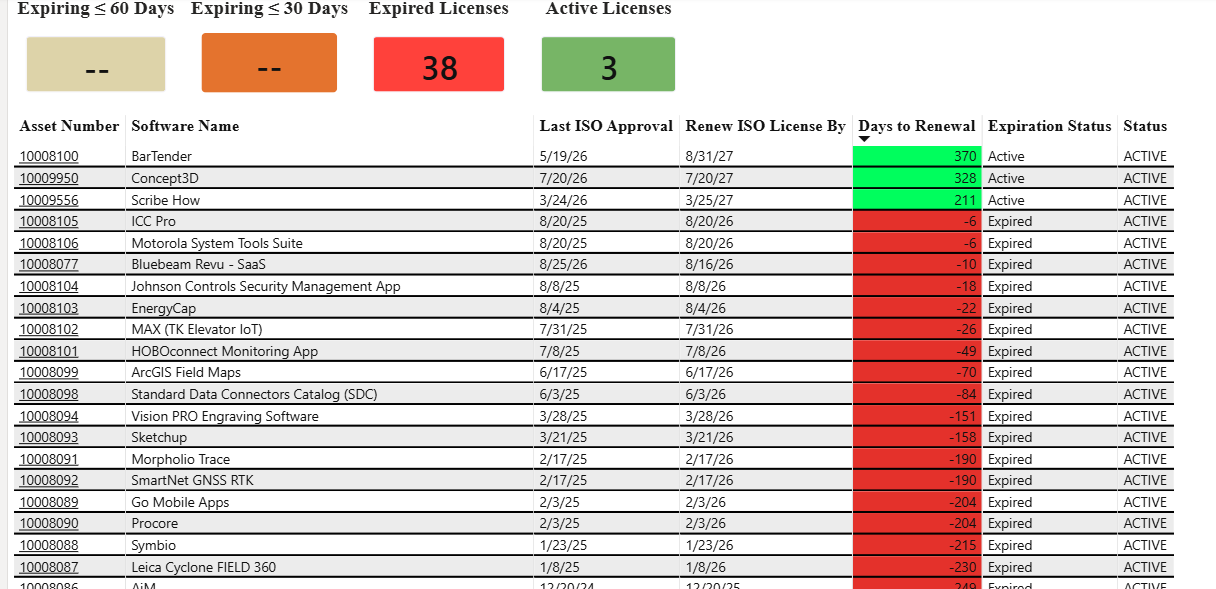
Explore projectA Power BI dashboard that tracks software approval renewals and helps prioritize procurement and security assessment requests.
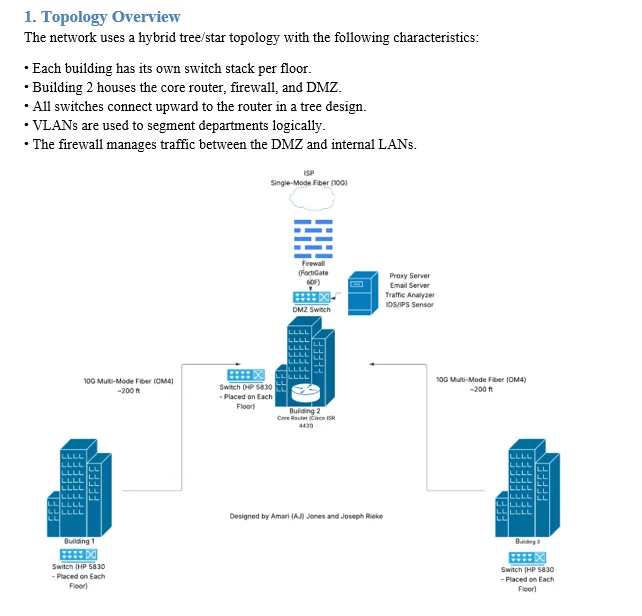
Explore projectA network architecture for a multi-building enterprise.
Explore project