Software Development
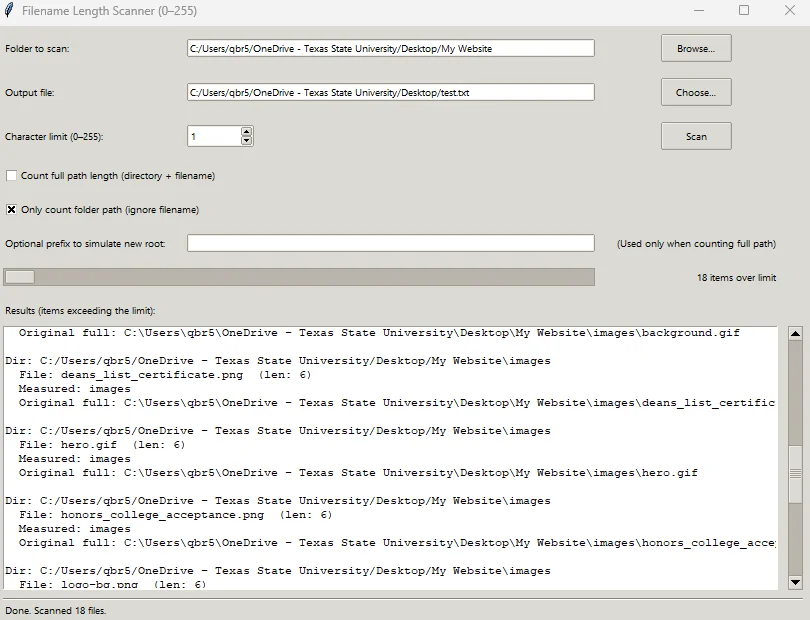
Filename Length Scanner
Find filenames and paths that exceed a chosen character limit.
Explore projectAn executive-facing Power BI dashboard for reviewing capital project progress, organizational workload, budgets, risks, and notes.
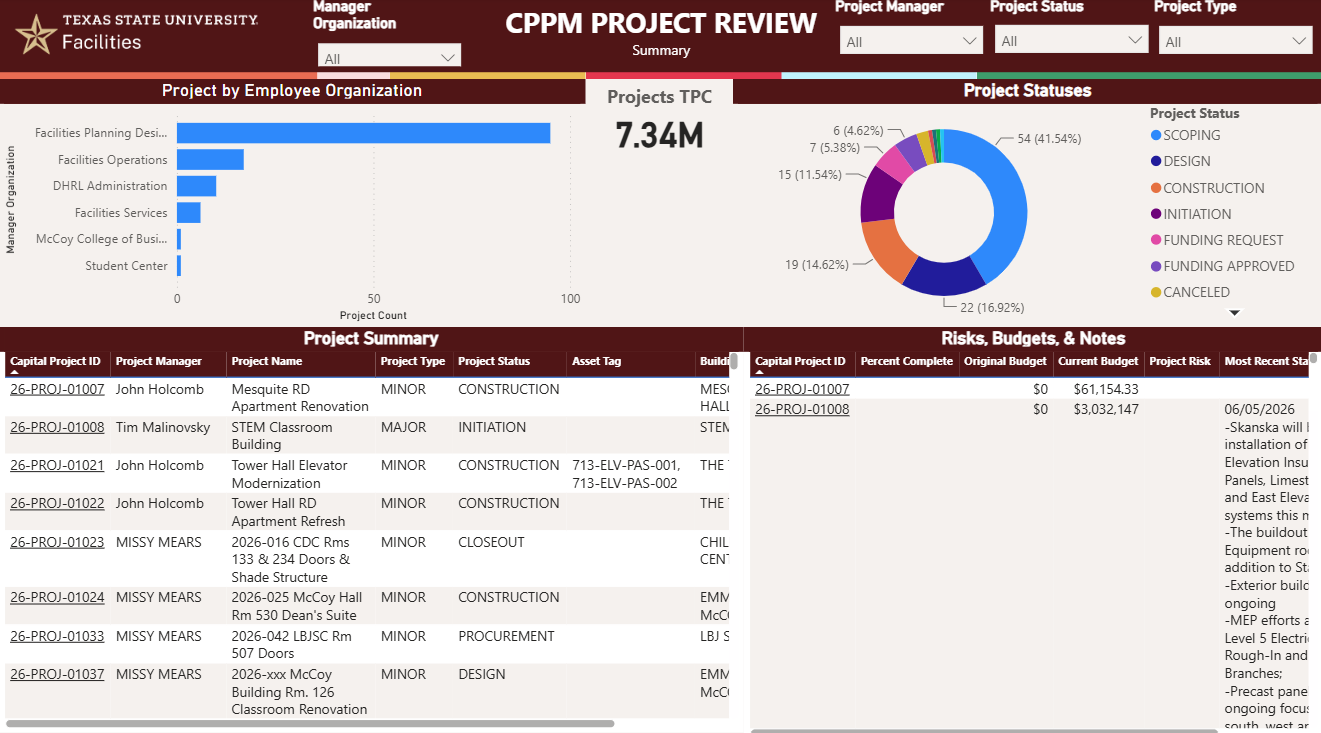
Executives needed a closer look at the progress of a broad portfolio of capital projects. The dashboard brings project information together so leaders can review the overall portfolio and focus on the projects relevant to a particular manager, organization, status, or project type.
I developed the Capital Projects Review Dashboard in Power BI, combining executive summary visuals with detailed project tables. Filters allow users to narrow the view by manager organization, project manager, project status, and project type.
The summary brings together project distribution, a Projects TPC indicator, and project-level information to support a more focused review of progress and financial context.
I developed the dashboard end to end, including its data preparation and calculations, report layout, visuals, and interactive filtering.
Leaders can start with the overall project distribution, then filter to the organization, manager, project type, or status they want to review. The project summary and budget, risk, and notes sections provide supporting detail for a closer look at individual projects.
The dashboard gave executives a closer view of capital project progress and made it easier to explore a large project portfolio through targeted filters. It supports review of project status alongside budget, risk, and recent-note information in one report.
Find filenames and paths that exceed a chosen character limit.
Explore projectAn IT risk assessment and continuity strategy for a utility provider.
Explore projectA responsive website for a fictional fitness club.
Explore project